The projected prices for Revenue Protection (RP) crop insurance is established using the December 2017 corn and November 2017 soybeans futures contracts closing prices for the month of February.
 |
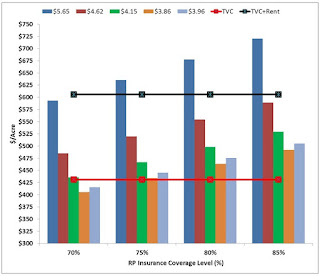
Figure 1.
2017 and Previous Years Corn Revenue Guarantee
($/Acre) Compared to Total Variable Costs (Red line)
and Total Variable Costs plus Rent (Black Line) at a
150 bushel/Acre APH Yield
|
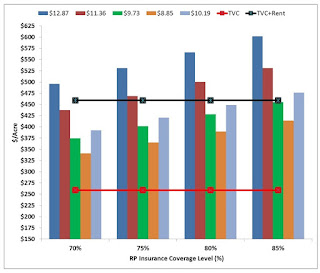
The rainbow of colored columns in Figure 1 and Figure 2 represent the RP insurance revenue guarantees provided for the 2013 (dark blue), 2014 (dark red), 2015 (green), 2016 (orange), and 2017 (light blue) crop years. The multi-year comparison illustrates how the crop insurance safety net has declined over the last five years as ending stocks for corn and soybeans have rebuilt after the 2012 drought. The red line is the 2017 budgeted per acre input costs, and the black line is the input costs plus budgeted cash rent. The corn and soybean APH yields are 150 and 55 bushels/acre, respectively, for Figure 1 and Figure 2.
 |
Figure 2.
2017 and Previous Years Soybean Revenue Guarantee
($/Acre) Compared to Total Variable Costs (Red line)
and Total Variable Costs plus Rent (Black Line) at a
55 bushel/Acre APH Yield.
|
Figure 2 demonstrates the potential for an improved revenue safety net for soybeans in 2017. The projected price for soybeans of $10.19/bushel is a $1.34/bushel increase over the 2016 price (Figure 2). The 2017 projected soybean price is $2.68/bushel lower than the 2013 insurance guarantee. Figure 2 suggests that a revenue safety net that covers total inputs and cash rent might be available at the 85% coverage level depending on the APH yield, cost of the insurance, and the farm’s cost structure. At the 80% coverage level, the 2017 revenue guarantee is $59/acre larger than last year (Figure 2).
 |
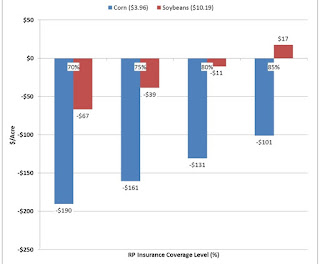
Figure 3.
2017 Corn (blue) and Soybean (red) RP Revenue
Guarantee Compared to Total Variable Costs Plus
Cash Rent for Various Coverage Levels.
|
Remember that the deadline to make your 2017 crop insurance decision is March 15, 2017.
No comments:
Post a Comment
Note: Only a member of this blog may post a comment.